

According to Rod Trent, Kusto is named after Jacques Cousteau. He says, “We are exploring the depths of our data” by searching and querying our Azure log data. His book is a great introduction and is helpful even if you’ve been using Kusto Query Language (KQL) for a while. I learned a lot along the way, but his book helped to solidify my knowledge. This post will focus on using KQL with Azure SQL audit data. For this post, I will use Kusto and KQL interchangeably.
What is Kusto (KQL)?
According to Microsoft, “Kusto Query Language (KQL) is a powerful tool to explore your data and discover patterns, identify anomalies and outliers, create statistical modeling, and more. The query uses schema entities that are organized in a hierarchy similar to SQLs: databases, tables, and columns.”
Note: KQL is case-sensitive for everything. Also, remember to refrain from querying everything just like you wouldn’t with SQL — don’t do the equivalent of SELECT * from gianttable.
Microsoft also has a lot of documentation with best practices and a quick reference guide to the Kusto commands. This blog post covers the ones I use the most.
Where Can You Use KQL?
It’s used in a lot of places, including, but not limited to:
- Azure Data Explorer
- Microsoft Sentinel
- Azure Monitor
- Log Analytics
- Log alert rules
- Workbooks
- Azure dashboards
- Azure Logic Apps
- PowerShell
- Azure Monitor Logs API
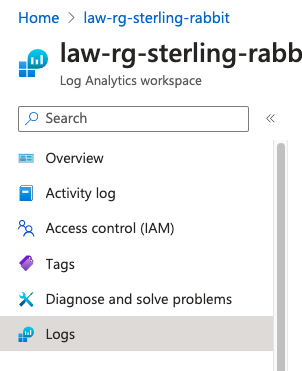
Using KQL in Log Analytics Workspaces
I use Kusto primarily in Log Analytics workspaces. Most of what you can use in Log Analytics, you can use in the other places Kusto is used. You can either query it via logs:
Or, if you want more of a repeatable report format, you can use workbooks:
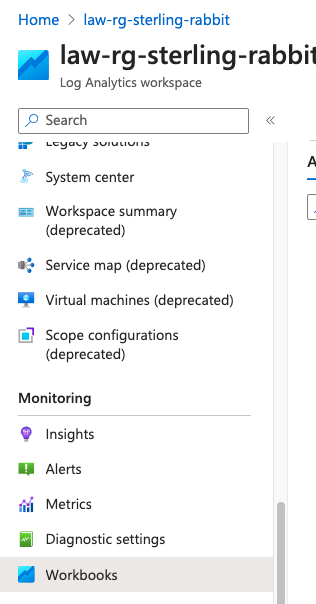
For this post, I will be using logs. If you want more workbook information, please see my previous blog post on setting one up.
Common Operators
There are a lot of operators you can use in KQL, but some of the more common types of operations you can perform are:
- Searching
- Selecting a time range
- Selecting which columns to display
- Filtering
- Sorting
- Counting
- Summarizing
- Limiting
- Charting
- Commenting
I will go through each of these in turn below.
Search Operator
Let’s say you want to find a create table statement in your audit results.
search "create table"
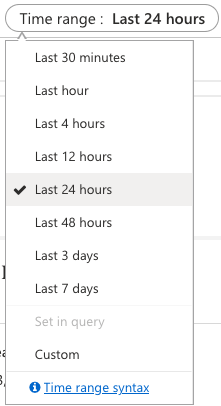
Depending on when this create table statement happened, you may have to add another operator to change the time range. By default, the logs will retrieve anything in the last 24 hours, but you can change the time range:
What the search operator will return depends on what happened in your environment, but mine returns this when I select “Last 7 days” in the time range:
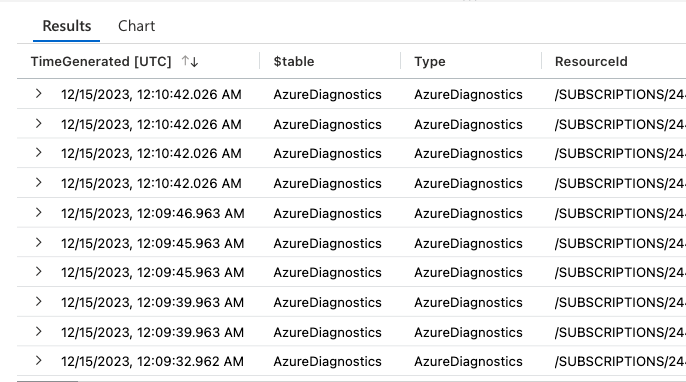
It’s hard to know precisely what happened with those results, so it’s best to set which columns you want to see.
Project Operator
You use the project operator to set which columns you want to see. To determine which columns you could use, you can click the > on any of the results from your search:
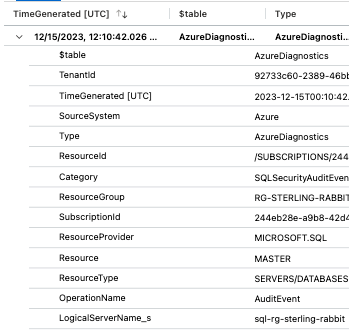
This will allow you to see all the columns you could project into your results. There are many of them, and the screenshot above is a cross-section.
By adding the project operator to your KQL, you will only see those columns in your results:
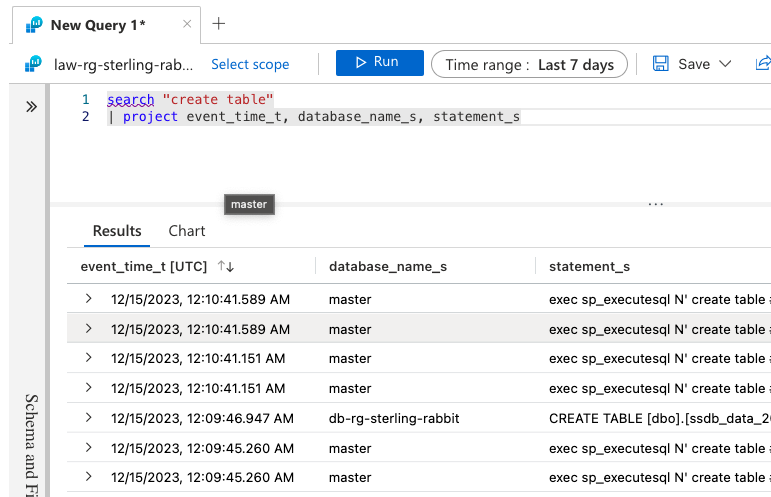
search "create table"
| project event_time_t, database_name_s, statement_s
The previous query will give you results like this:
At this point, you may want to filter out some results, especially if you know which db this happened in and if you don’t want to see stuff happening in the master db that the engine is doing.
Filter Operators
You can filter using the where operator or the and operator, but you can’t use this with the search operator. At this point, you need to figure out the table and the category of your results before you can filter them. Going back to the search(“create table”) results, we need to pick out those items:
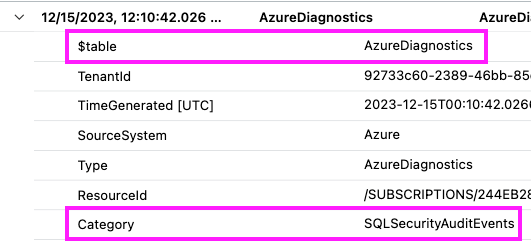
Then, you can build a query to filter the results like so:
AzureDiagnostics
| where Category == 'SQLSecurityAuditEvents'
| where database_name_s != 'master'
  and TimeGenerated > ago(7d)
| project
	event_time_t,
	database_name_s,
	statement_s,
	server_principal_name_s,
	succeeded_s,
	client_ip_s,
	application_name_s,
	additional_information_s,
	data_sensitivity_information_s
Note: You can either use | where to filter or once you’ve used | where once you can add clauses with and, as shown in the example above. You can also put TimeGenerated if you want to keep it in your query instead of using the dropdown in the logs windows. I highly recommend putting TimeGenerated in the query filter. For more ways to query time, visit this site from the Kusto King.
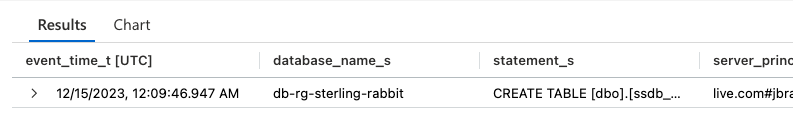
You can also choose what to include, just like in SQL, instead of excluding the master like so:
| where database_name_s == 'db-rg-sterling-rabbit' That full query from above will give me these results:
Let’s say you had a lot of results, and they are in some random date order; you will need to use another operator to sort them.
Sort Operators
It’s as easy as adding order by or sort by to the query:
| order by event_time_t descLimit Operator
For this, you can use limit or take. It will limit the number of rows returned. I use this if I want a quick look or if the results may be copious:
| limit 100 Count Operator
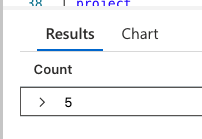
Let’s say you want to get a count of all the audit actions:
AzureDiagnostics
| where Category == 'SQLSecurityAuditEvents'
| count
In this query, you will get this type of result:
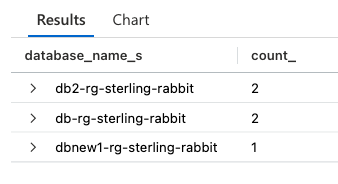
You can also count by other items in the data, like by database name:
AzureDiagnostics
| where Category == 'SQLSecurityAuditEvents'
| summarize count () by database_name_s
Those results would look like this:
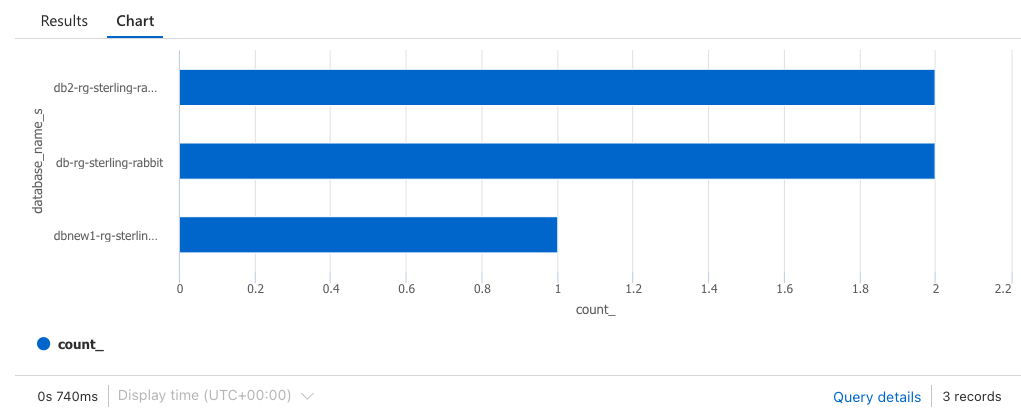
Creating a Chart from Results
It’s pretty easy to make a chart from the results. It’s as easy as adding one additional line of code to the count query from above:
AzureDiagnostics
| where Category == 'SQLSecurityAuditEvents'

| summarize count () by database_name_s
| render barchart
This will produce a chart like this:
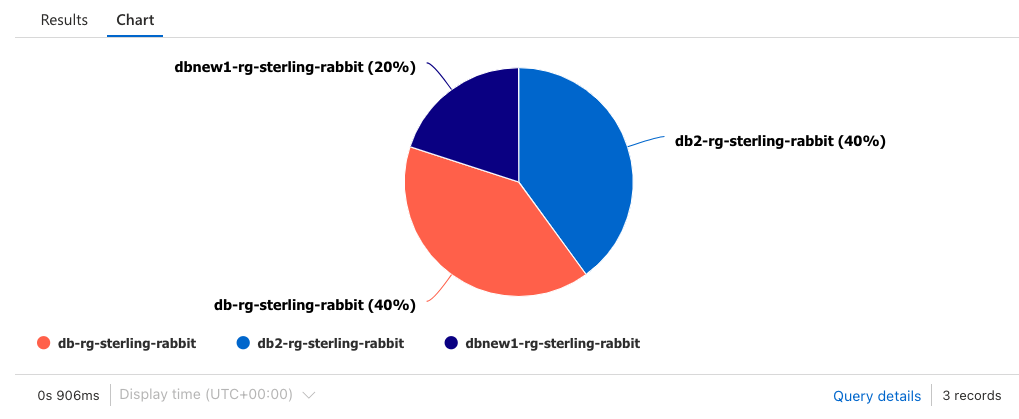
Or you could do a piechart which is as simple as saying render piechart instead of render bar chart:
Commenting
You may want to comment out parts of your code. This is quickly done by using two backslashes:
AzureDiagnostics
| where Category == 'SQLSecurityAuditEvents'
| where database_name_s != 'master'
//| where database_name_s == 'db-rg-sterling-rabbit'
  and statement_s startswith "create table"
  and TimeGenerated > ago(7d)
The where database_name_s == is commented out with the previous query and won’t be executed.
Summary
These are the basics of things I use in Kusto in Log Analytics. It’s very powerful, and there are a lot more things you can do.
For more advanced KQL examples, visit Fun with KQL.
Here’s a cheat sheet to help you with Kusto commands. Since you found this via the data path, this SQL to Kusto cheat sheet will help you understand how you would build a Kusto query compared to SQL.
I hope you enjoy Kusto as much as I do. It’s a lot of fun!
mg4228